Analysis
Ichimoku Cloud Analysis 09.08.2022 (EURUSD, AUDUSD, NZDUSD)
EURUSD, “Euro vs US Dollar”
EURUSD is stuck inside the Triangle pattern. The instrument is currently moving inside Ichimoku Cloud, thus indicating a sideways tendency. The markets could indicate that the price may test the cloud’s …
EURUSD, “Euro vs US Dollar”
EURUSD is stuck inside the Triangle pattern. The instrument is currently moving inside Ichimoku Cloud, thus indicating a sideways tendency. The markets could indicate that the price may test the cloud’s upside border at 1.0215 and then resume moving downwards to reach 1.0095. Another signal in favour of a further downtrend will be a rebound from the rising channel’s downside border. However, the bearish scenario may no longer be valid if the price breaks the cloud’s upside border and fixes below 1.0260. In this case, the pair may continue growing towards 1.0350. To confirm a further downtrend, the price must break the pattern’s downside border and fix below 1.0120.
![]()
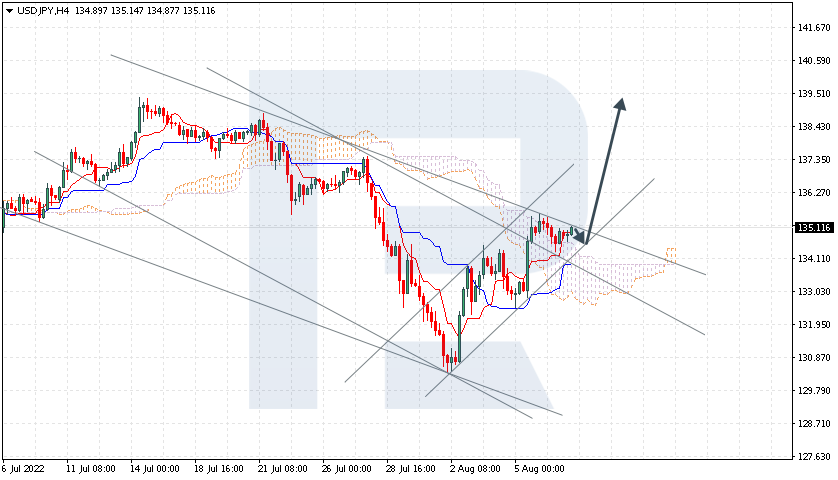
USDJPY, “US Dollar vs Japanese Yen”
USDJPY is rebounding from Tenkan-Sen. The instrument is currently moving above Ichimoku Cloud, thus indicating an ascending tendency. The markets could indicate that the price may test the cloud’s upside border at 134.85 and then resume moving upwards to reach 139.55. Another signal in favour of a further uptrend will be a rebound from the rising channel’s downside border. However, the bullish scenario may no longer be valid if the price breaks the cloud’s downside border and fixes below 131.90. In this case, the pair may continue falling towards 130.90. To confirm a further uptrend, the price must break the bearish channel’s upside border and fix above 135.35.
![]()
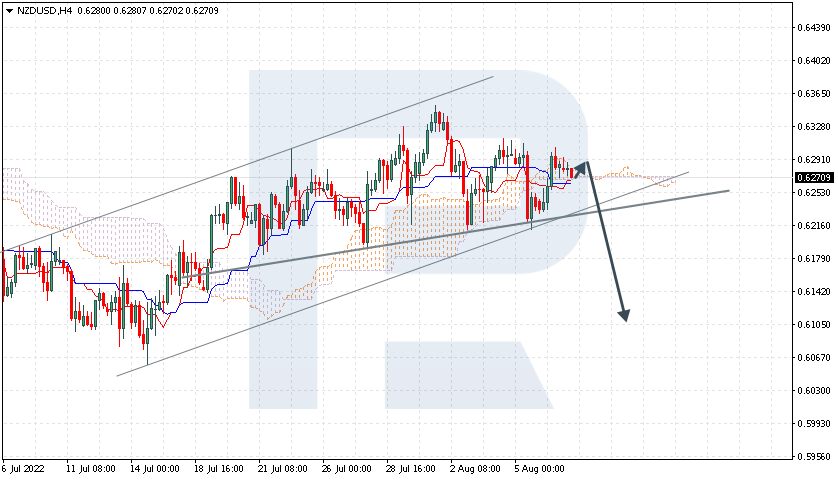
NZDUSD, “New Zealand Dollar vs US Dollar”
NZDUSD is correcting within a Head & Shoulders reversal pattern. The instrument is currently moving inside Ichimoku Cloud, thus indicating a sideways tendency. The markets could indicate that the price may test the cloud’s upside border at 0.6275 and then resume moving downwards to reach 0.6105. Another signal in favour of a further downtrend will be a rebound from the resistance area. However, the bearish scenario may no longer be valid if the price breaks the cloud’s upside border and fixes above 0.6310. In this case, the pair may continue growing towards 0.6405. To confirm a further downtrend, the price must break the “neckline” of the Head & Shoulders pattern and fix below 0.6205.
![]()

")

