Analysis
Murrey Math Lines 29.03.2023 (USDJPY, USDCAD)
USDJPY, “US Dollar vs Japanese Yen”
On H4, USDJPY quotes are under the 200-day Moving Average, which means the prevalence of a downtrend. The RSI is testing the resistance line. In this situation, the level 4/8 (131.25) could break downw…
USDJPY, “US Dollar vs Japanese Yen”
On H4, USDJPY quotes are under the 200-day Moving Average, which means the prevalence of a downtrend. The RSI is testing the resistance line. In this situation, the level 4/8 (131.25) could break downwards, and the price could fall to the support level 2/8 (128.12). The scenario can be canceled if the price rises above the resistance at 5/8 (132.81). In this case, the pair could rise to 6/8 (134.37).
![]()
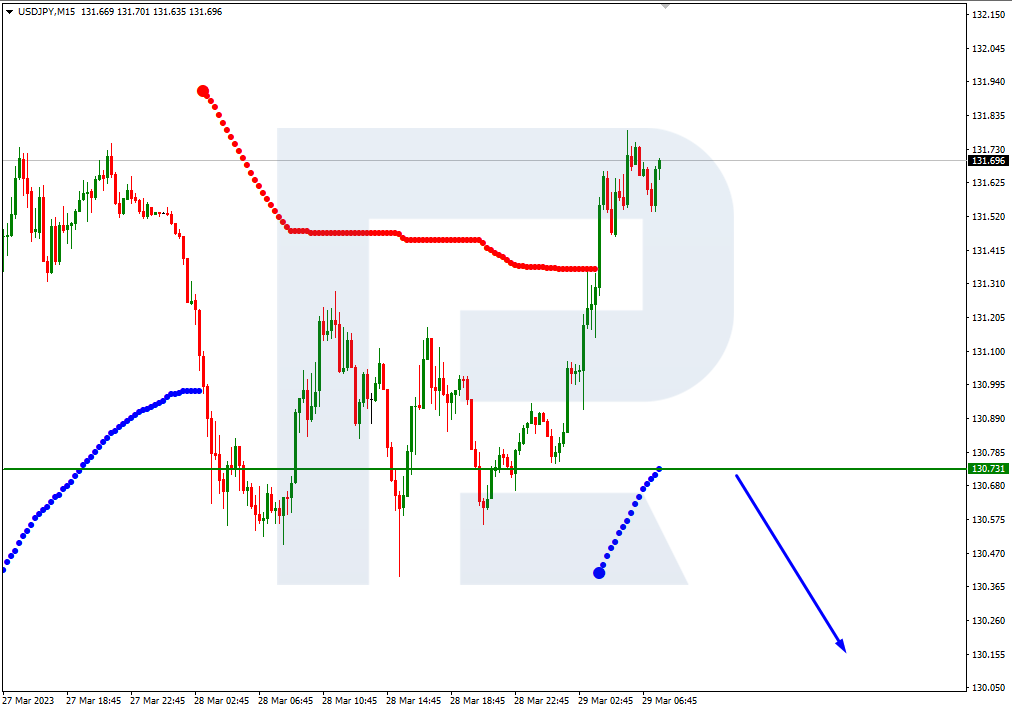
On M15, breaking the lower line of the VoltyChannel indicator can increase the chances for price falling.
![]()
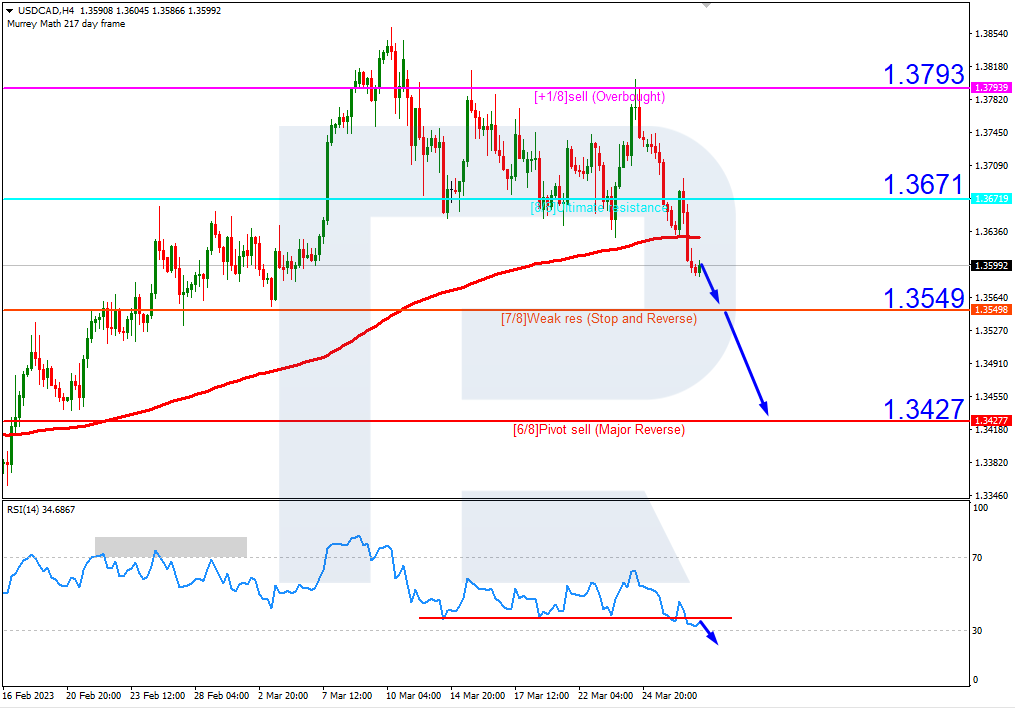
USDCAD, “US Dollar vs Canadian Dollar”
On H4, USDCAD quotes broke the level 8/8 (1.3671) downwards and escape the overbought area. The RSI broke the support line. In such circumstances, we should expect the price to keep falling to the support level 6/8 (1.3427). The scenario can be canceled if the price rises above the resistance at 8/8 (1.3671). In this case, the pair will be growing again, and the quotes could return to +1/8 (1.3793).
![]()
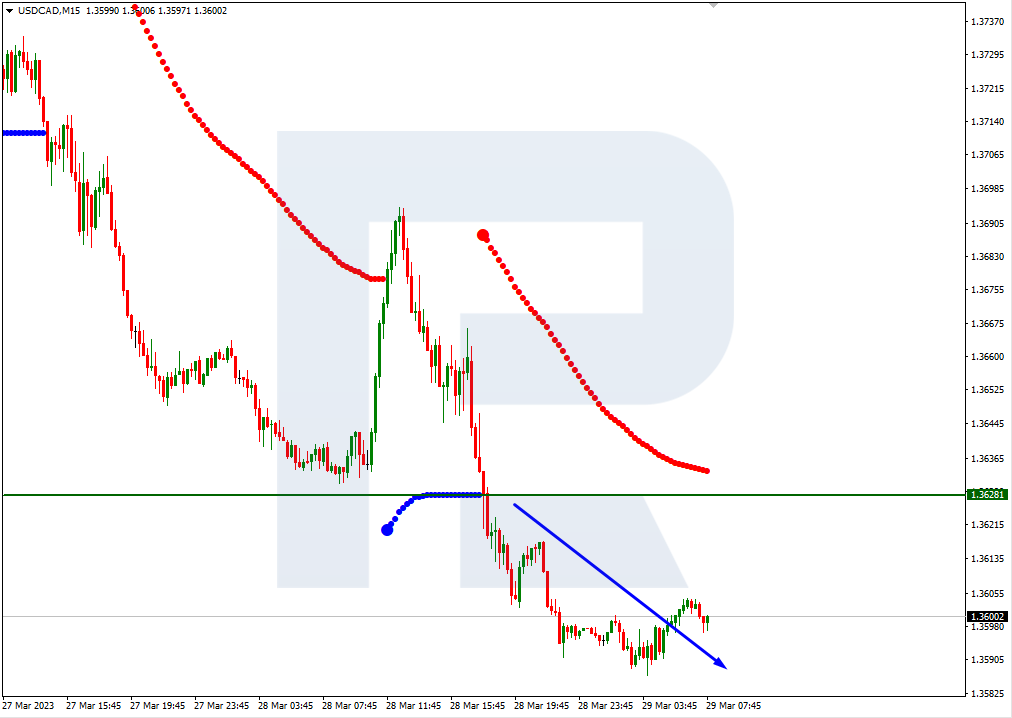
On M15, the lower line of VoltyChannel has broken. This increases the probability of further price falling.
![]()

")

