Analysis
Murrey Math Lines 24.05.2022 (AUDUSD, NZDUSD)
AUDUSD, “Australian Dollar vs US Dollar”
As we can see in the H4 chart, AUDUSD is trading below the 200-day Moving Average to indicate a descending tendency. In this case, the price is expected to break 2/8 and then continue falling to r…
AUDUSD, “Australian Dollar vs US Dollar”
As we can see in the H4 chart, AUDUSD is trading below the 200-day Moving Average to indicate a descending tendency. In this case, the price is expected to break 2/8 and then continue falling to reach the support at 1/8. However, this scenario may no longer be valid if the price breaks the resistance at 3/8 to the upside. After that, the instrument may reverse and grow towards 4/8.
![]()
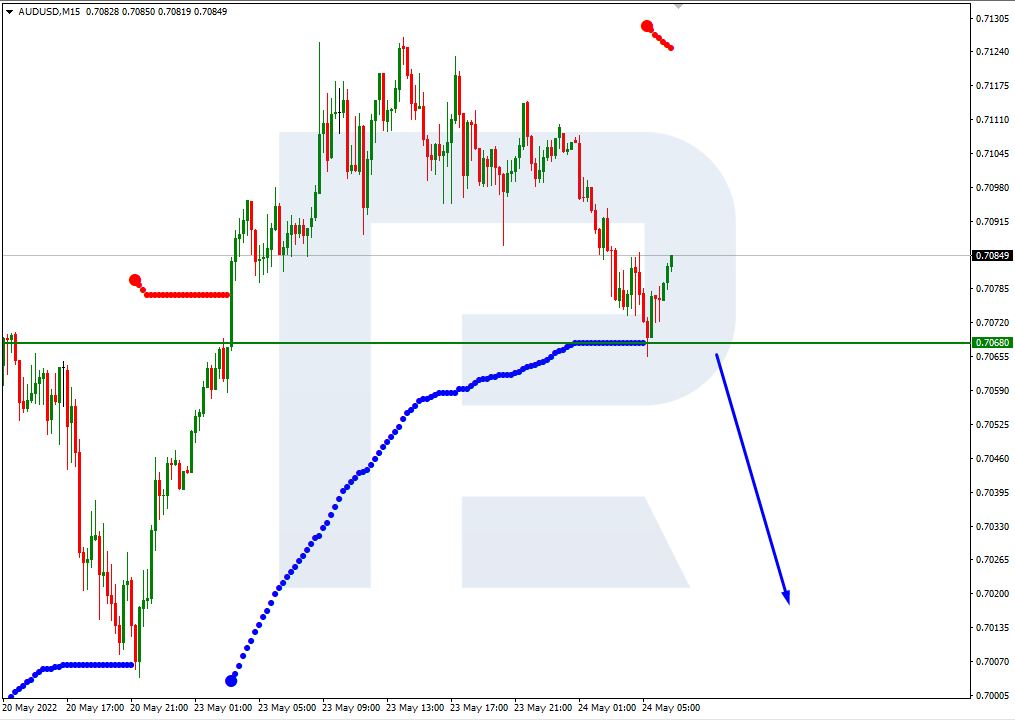
In the M15 chart, the pair may break the downside line of the VoltyChannel indicator and, as a result, continue trading downwards.
![]()
NZDUSD, “New Zealand Dollar vs US Dollar”
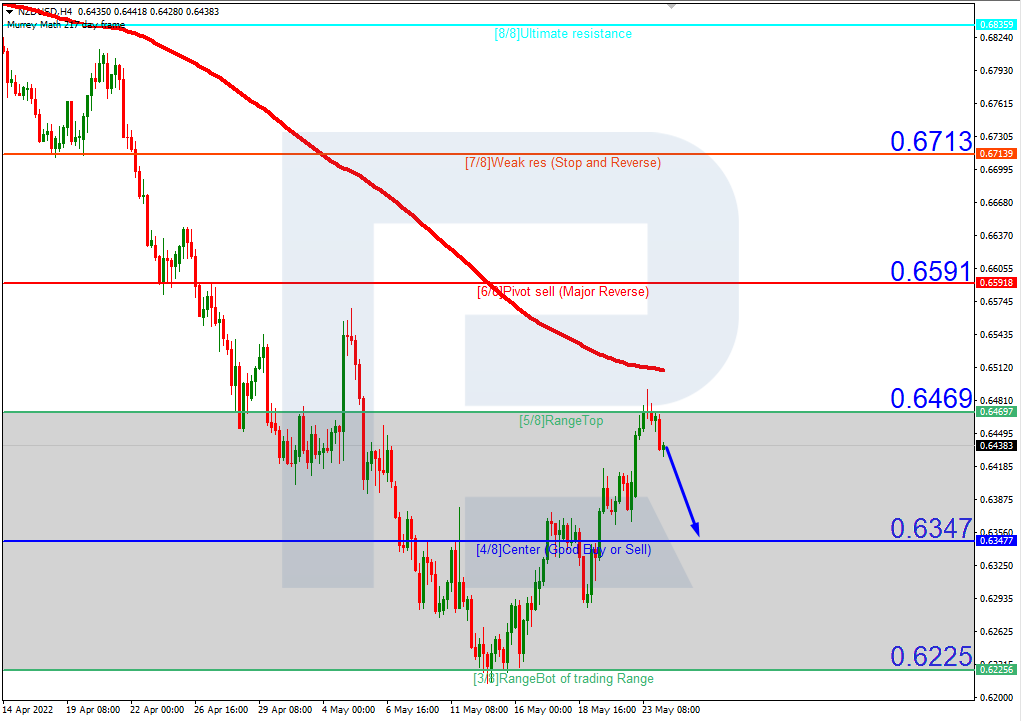
As we can see in the H4 chart, NZDUSD is also trading below the 200-day Moving Average. In this case, the price is expected to continue moving downwards to reach the closest support at 4/8. However, this scenario may no longer be valid if the price breaks the resistance at 5/8 to the downside. After that, the instrument may grow towards 6/8.
![]()
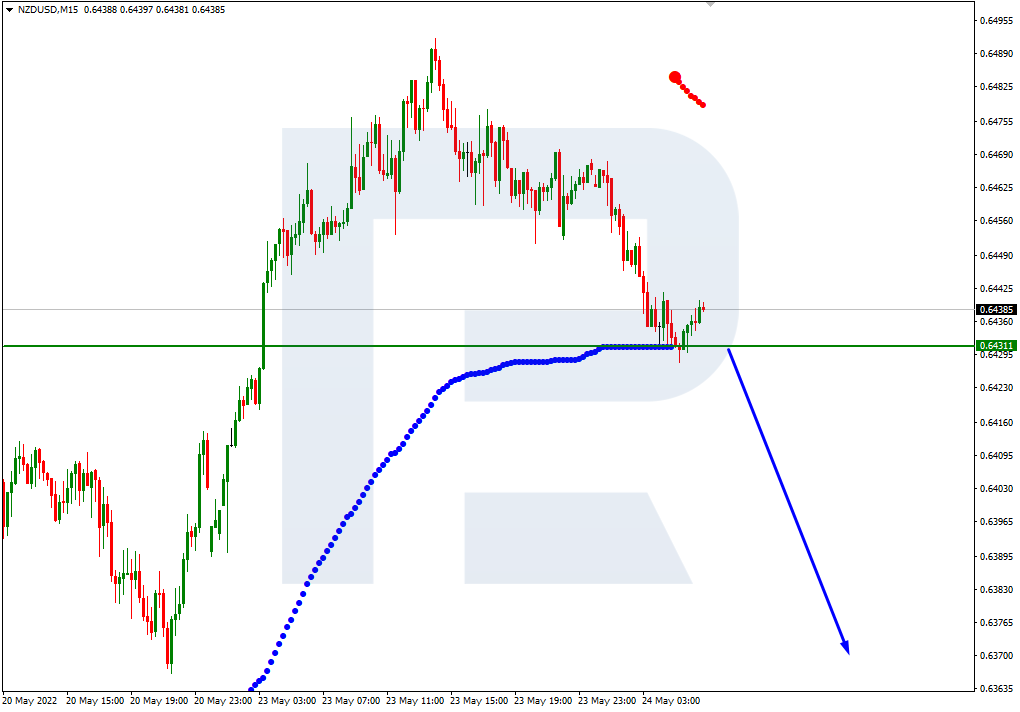
In the M15 chart, the pair may break the downside line of the VoltyChannel indicator and, as a result, continue its decline and reach 4/8 from the H4 chart.
![]()

")

